
droenn
Fat Man's XC President
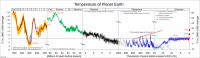
Draw a line of best fit across the peaks in the rises and falls in global temp since the 600,000 year mark and you're pretty much bang on the rapid rise temp figure projected for 2100.
I'm not sure how you're interpreting this figure, but I'm simply looking at 4 degrees above the 20th century average (2100 projection). That hasn't been apparent since the start of the Pliocene following the late Miocene cooling.
I don't think you can just fit linear trends to match up a couple of points, that tends to discard most of the process. Especially when you are trying to fit across different epochs. Even if you do try and fit a linear trend to climate change it doesn't work, as its accelerating - which is backed up by a wealth of literature.
Last edited:
 Not my intent.