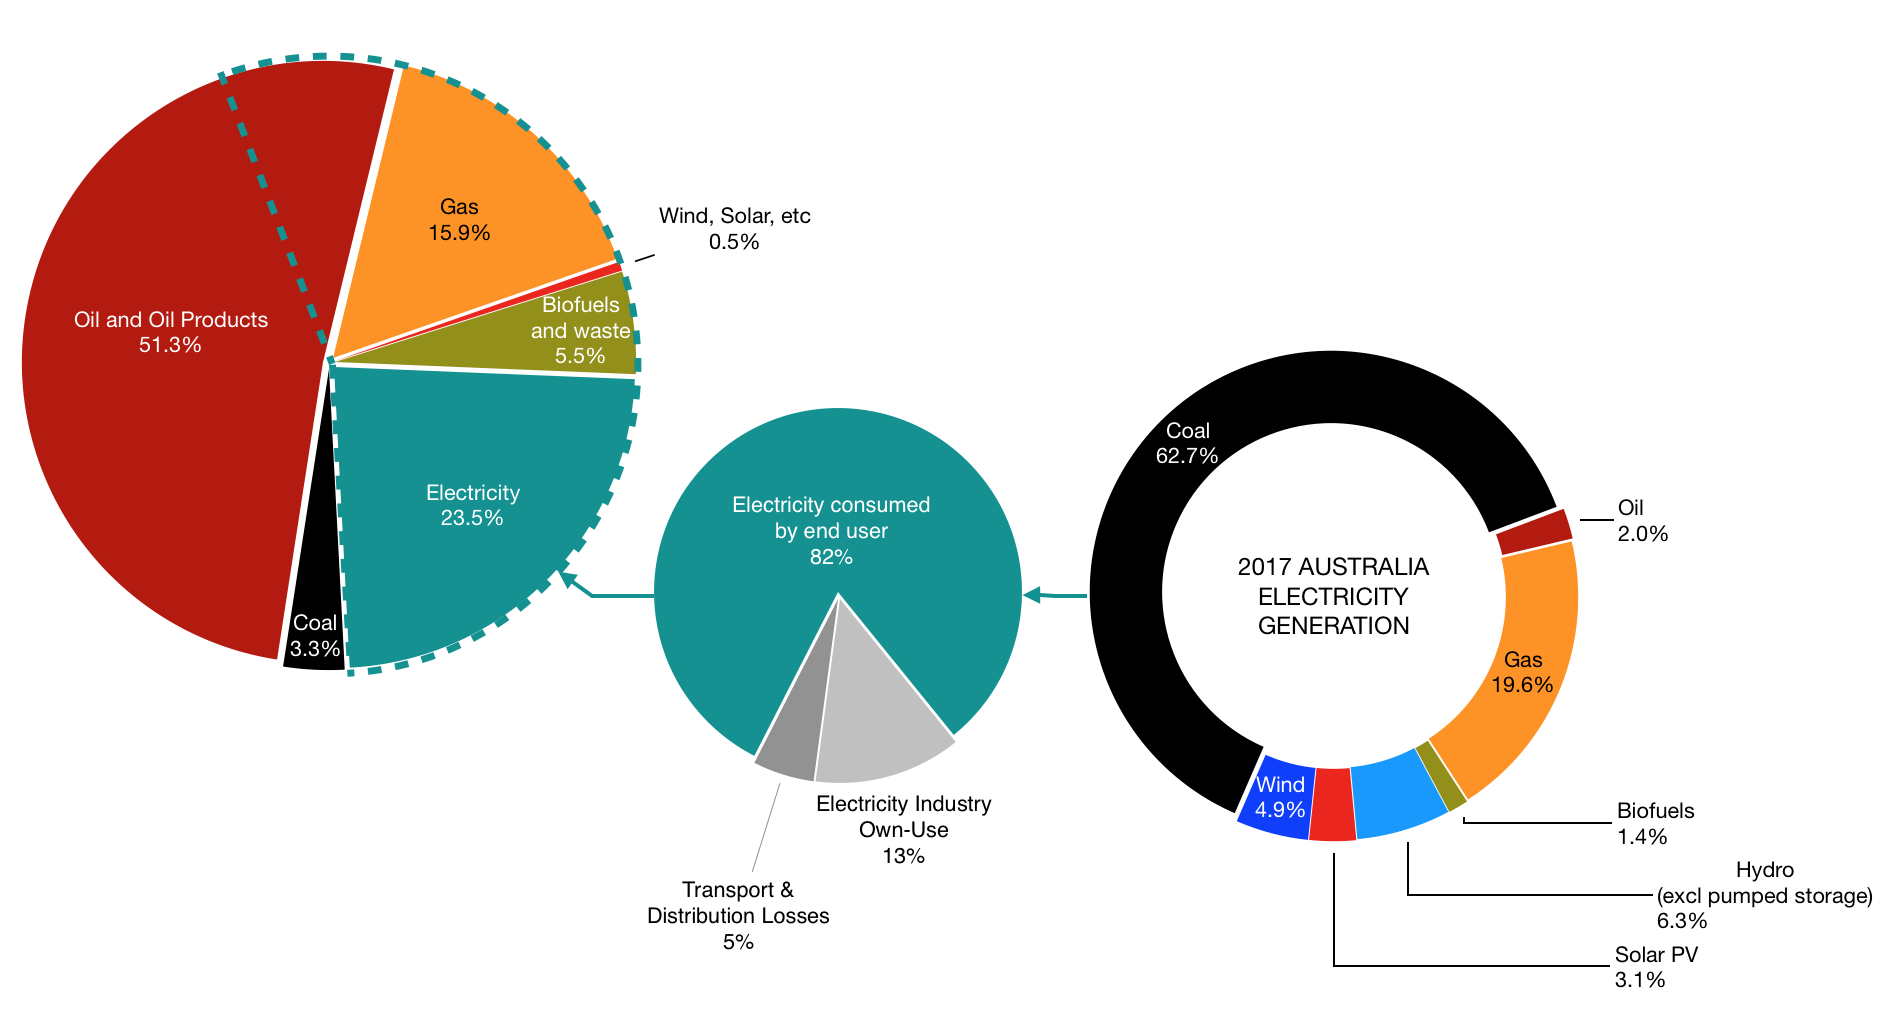
Chart 8. Australia’s energy consumption and electricity generation in 2017. Data: IEA.
7 The dashed segment in the left hand most pie chart represents the equivalent share of electricity if the quantity produced in 2017 was produced within a 100% wind/water/solar (WWS) energy system, serving to demonstrate the remaining change needed for full electrification. The 23.5% in 2017 equates to 55% under WWS, as shown. The share of electricity becomes greater because total energy consumption of a 100% WWS system reduces to 42.9% of business-as-usual.
15 16 This is due to: (a) using heat pumps for building heat; (b) using electricity for industrial heat; (c) using battery and hydrogen fuel cell vehicles; (d) eliminating mining, transportation and processing of fuels, and (e) efficiency improvements. AlsoNote: (i) Non-energy use of energy sources excluded (e.g. oil used for lubrication); (ii) Transport & Distribution Losses include gas distribution, electricity transmission, and coal transport, and (iii) Examples of Electricity Industry Own-Use include energy consumed in coal mines, own consumption in power plants and energy used for oil and gas extraction.
17